National Bank Financial - Wealth Management (NBFWM) is a division of National Bank Financial Inc. (NBF), as well as a trademark owned by National Bank of Canada (NBC) that is used under license by NBF. NBF is a member of the Canadian Investment Regulatory Organization (CIRO) and the Canadian Investor Protection Fund (CIPF), and is a wholly owned subsidiary of NBC, a public company listed on the Toronto Stock Exchange (TSX: NA). The information contained herein has been prepared by Eric Van Enk, Associate Portfolio Manager and Wealth Advisor at NBF. I have prepared this article to the best of my judgment and professional experience to give you my thoughts on various financial aspects and considerations. The opinions expressed represent solely my informed opinions and may not reflect the views of NBF. The particulars contained herein were obtained from sources we believe to be reliable but are not guaranteed by us and may be incomplete. The opinions expressed are based upon our analysis and interpretation of these particulars and are not to be construed as a solicitation or offer to buy or sell the securities mentioned herein. The opinions expressed do not necessarily reflect those of NBF.
Market returns after sharp rallies
June 28 2025, Insight from Eric Van Enk, Wealth Advisor & Portfolio Manager
Market returns after sharp rallies
This week’s chart should be very interesting for those who follow the market closely. The National Bank economics department has tracked S&P 500 returns going back to 1970 and segmented those returns into periods immediately following a sudden (greater than 15% return over a 6-week period) market rally vs. all other observations. From there, the data is further segmented into three, six, and twelve-month returns.
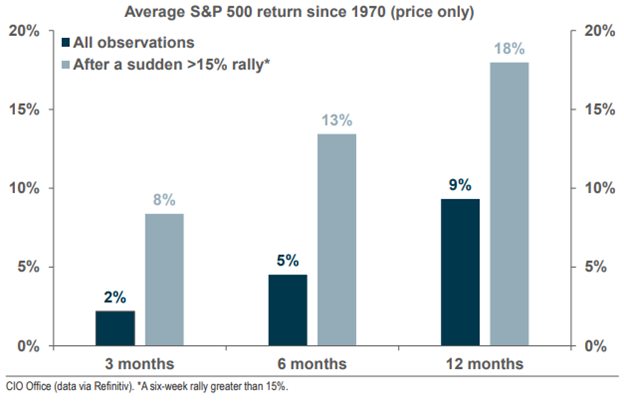
Source: National Bank Financial
Average market returns since 1970 are shown in dark blue while market returns immediately following a significant market rally (greater than 15%) are shown in light blue / grey. Notice over a three-, six- and twelve-month period, S&P 500 market returns have been meaningfully higher immediately following a sharp market rally (grey bars higher than blue bars over each period). These results may be counterintuitive to some, especially those who tend to view market returns through the lens of reversion to the mean.
Reversion to the mean is simply a sophisticated way of saying most data sets tend to produce results close to their historic average over time. For example, if the average one-year return for the S&P 500 is 9% (shown in dark blue in the chart) and the market has been experiencing several years of returns below 9%, we should expect market returns above 9% at some point to average 9% over the long term. Although this may be true over longer timeframes, the data clearly shows it isn’t the case for periods of less than one year. As depicted in this week’s chart, three-month S&P 500 returns have averaged 2% since 1970, however, the average increases to 8% immediately following a sharp market rally. The same is true over six- and twelve-month periods where returns immediately following a 15% market rally have substantially outpaced all other observations (13% vs. 5% over 6 months & 18% vs. 9% over 12 months).
The chart summary is S&P 500 returns tend to have momentum for periods of less than one year. Market rallies greater than 15% over a short period (6 weeks) have historically preceded periods of above average market performance. The obvious caveat is the chart is based on average returns since 1970, and past market returns should not be used to forecast future returns.
Eric Van Enk, Wealth Advisor & Portfolio Manager
National Bank Financial – Wealth Management
Medicine Hat, AB

